The history of mortgages in the U.S. over the past five decades is a story of dramatic economic shifts, evolving lending practices, and changing homebuying trends. From the sky-high interest rates of the early 1980s to the record lows during the 2010s and pandemic era, mortgage lending has continually adapted. Understanding mortgage interest rates over time, key housing market trends, and the impact of events like inflation, recessions, and the mortgage crisis can help today’s homebuyers put the current market into perspective. This article provides an in-depth yet easy-to-read overview of U.S. mortgages by decade – from the 1970s to the 2020s – highlighting major economic events, how lending practices shifted, and what it meant for home affordability in each era. We’ll also look at how mortgage debt in the U.S. has grown over time, with helpful graphs and an interactive mortgage calculator (placeholder) for readers.
1970s: Inflation and the Rise of Modern Mortgages
The 1970s were characterized by surging inflation and the beginnings of the modern mortgage market structure. At the start of the decade, 30-year mortgage interest rates hovered in the 7%–8% range – relatively affordable by later standards (Historical 30-Year Fixed-Rate Mortgage Trends With Charts) (Mortgage Rate History: A Look at Trends from the 1970s to 2024). However, multiple oil price shocks and economic troubles led to “stagflation” (stagnant growth + high inflation). By the end of the 1970s, inflation was running in double digits, and mortgage rates had climbed to around 12–13% (Historical 30-Year Fixed-Rate Mortgage Trends With Charts) (Mortgage Rate History: A Look at Trends from the 1970s to 2024). This steady rise in rates dramatically reduced home affordability, as higher borrowing costs meant significantly larger monthly payments for the same loan amount.
Major economic events: The Arab oil embargo of 1973–74 triggered a recession and persistent inflation. In response, the Federal Reserve (under Chairman Paul Volcker from 1979) adopted aggressive anti-inflation policies, pushing up overall interest rates. Although the Fed doesn’t set mortgage rates directly, its policy strongly influences them. By 1979, with inflation still raging, Volcker began sharply raising the federal funds rate to choke off inflation. Mortgage lenders braced for the impact – and indeed, by 1979 the average 30-year fixed mortgage rate was about 11.2%, up from around 7.5% in 1971 (Mortgage Rate History: A Look at Trends from the 1970s to 2024).
Shifts in lending practices: During this era, the standard 30-year fixed-rate mortgage (often with a 20% down payment) became firmly entrenched as the norm for home loans (Historical 30-Year Fixed-Rate Mortgage Trends With Charts). Federal programs from earlier decades (like FHA and VA loans and the creation of Fannie Mae and Freddie Mac) had made homeownership more accessible, and by the 1970s millions of Americans were buying homes with long-term fixed mortgages. However, the rapid inflation created new challenges for lenders. Savings and Loan institutions (S&Ls), which financed many mortgages with short-term deposits, found themselves squeezed when deposit rates rose but their outstanding mortgages were locked in at lower fixed rates (Evolution of the U.S. Housing Finance System) (Evolution of the U.S. Housing Finance System). To adapt, regulators in 1978–1980 began allowing new products like adjustable-rate mortgages (ARMs), which could reset with interest rate changes, as well as creative loans (graduated payment mortgages, etc.) to help both lenders and borrowers manage the high-rate environment (Evolution of the U.S. Housing Finance System). These innovations were just starting to appear by the end of the 1970s.
Impact on home affordability: For homebuyers, the late 1970s were challenging. Incomes were rising with inflation, but mortgage rates rose even faster, making it harder to qualify for loans. A mortgage at 12%+ interest greatly increased the cost of buying a home – many buyers found the cost of monthly payments increasingly out of reach as the decade ended. Home price appreciation was mixed: inflation pushed housing prices up in nominal terms, but in many areas high rates cooled real housing demand. By 1979–1980 the stage was set for even more dramatic interest rate moves in the coming years, which would further test homebuyers’ resilience.
1980s: Sky-High Rates, Recession, and Regulatory Change
The 1980s opened with a bang in the mortgage market. To finally break the back of double-digit inflation, the Federal Reserve drove interest rates to extreme heights in the early ’80s. This led to the highest mortgage rates in modern U.S. history and a severe recession – a difficult combination for would-be homebuyers.
Major economic events: In 1980–1982, the U.S. experienced back-to-back recessions as the Fed’s tightening took effect. Inflation, which peaked around 14% in 1980, began to fall, but only after the prime rate (and by extension mortgage rates) hit unprecedented levels (Is this time really different? A history of interest rate cycles) (Mortgage Rate History: A Look at Trends from the 1970s to 2024). The average 30-year mortgage rate hit an all-time high of about 16–18% in late 1981 (Historical 30-Year Fixed-Rate Mortgage Trends With Charts) (Mortgage Rate History: A Look at Trends from the 1970s to 2024). Many prospective buyers were priced out of the market, and housing activity plummeted. Unemployment surged above 10%, and the construction industry was hard-hit. This era also saw the Savings & Loan crisis: hundreds of S&L banks that had thrived on home lending collapsed due to the interest-rate mismatch and past regulatory constraints (Evolution of the U.S. Housing Finance System) (Evolution of the U.S. Housing Finance System). The federal government intervened in 1989 with the Resolution Trust Corporation to clean up failed thrifts (Evolution of the U.S. Housing Finance System).
By the mid-1980s, as inflation was tamed (dropping to ~4% by 1983), mortgage rates began to fall from their peaks. The economy recovered strongly after 1983, entering a boom fueled in part by falling oil prices and tax cuts. By 1986–87, 30-year mortgage rates had come down to roughly 10–12% – still high, but much more manageable than the peaks earlier in the decade (Historical 30-Year Fixed-Rate Mortgage Trends With Charts) (Mortgage Rate History: A Look at Trends from the 1970s to 2024).
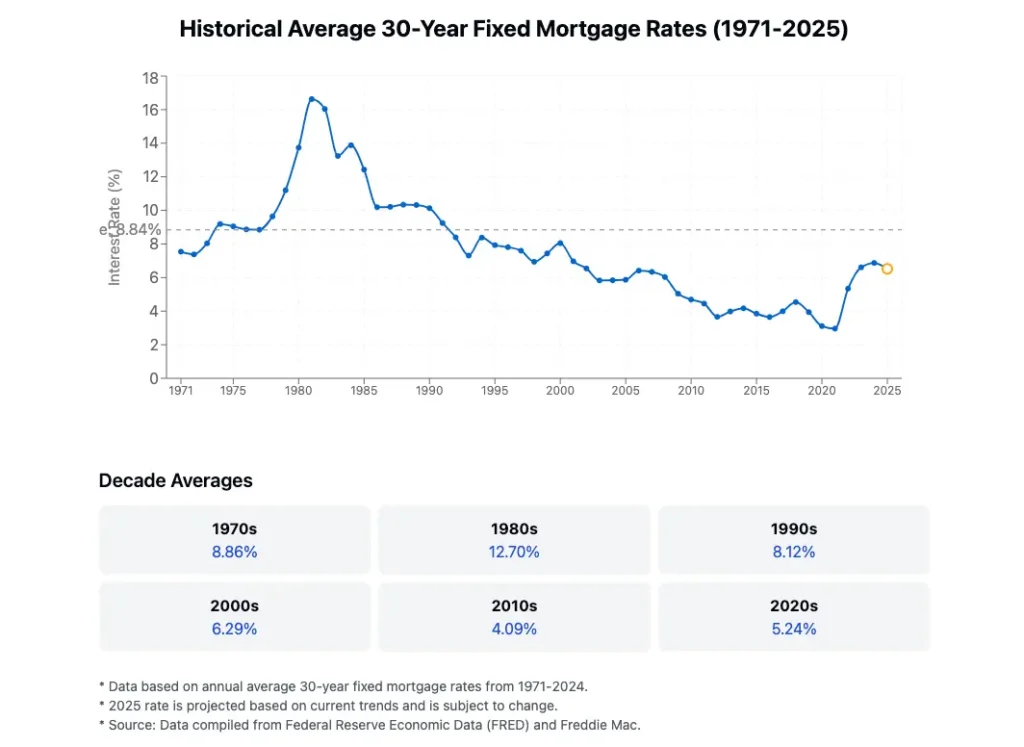
(Mortgage Rate History | Chart & Trends Over Time 2025) Mortgage interest rates (30-year fixed) from 1971 to 2025. Rates spiked above 15% in the early 1980s and have trended downward since, hitting historic lows in the 2010s (Historical 30-Year Fixed-Rate Mortgage Trends With Charts) (Mortgage Rate History: A Look at Trends from the 1970s to 2024).
Shifts in lending practices: The 1980s brought significant deregulation and innovation in mortgage finance. Depository institutions were freed from interest rate caps (Regulation Q was phased out by 1986) (Evolution of the U.S. Housing Finance System), allowing banks and S&Ls to compete for deposits even when rates were high. Lenders increasingly offered adjustable-rate mortgages (ARMs) starting in the early ’80s, which initially carried lower teaser rates to attract borrowers. In 1982, Congress passed the Garn–St. Germain Act, further loosening restrictions and enabling products like interest-only loans and ARMs to spread. The expansion of the secondary mortgage market accelerated: Fannie Mae and Freddie Mac, now government-sponsored enterprises (GSEs), along with Ginnie Mae, greatly increased the issuance of mortgage-backed securities (MBS) in the 1980s. By pooling and selling mortgages to investors, lenders replenished their funds, and mortgage credit became more widely available (including to more first-time buyers). However, it was still a more conservative era than the 2000s – most loans required substantial down payments and full documentation, and exotic subprime loans had not yet taken hold.
Impact on home affordability: Early in the decade, affordability was extremely poor despite slower house price growth, simply because interest rates were so high. In 1981, a $100,000 mortgage at 18% meant a monthly payment exceeding $1,500 (interest + principal), at a time when median household income was around $20,000 per year – a crushing burden for most families. Home sales and construction nosedived. As the decade progressed and rates fell back near 10%, buying a home became easier, and housing activity picked up. By 1986–1989, with mortgage rates finally back in single digits, more Americans were able to buy homes again (Mortgage Rate History: A Look at Trends from the 1970s to 2024). Indeed, the late ’80s saw a mini housing boom in some regions (and a subsequent cooling in the early ’90s). Overall, the 1980s taught a generation of buyers a hard lesson about mortgage rate volatility – and set the stage for the more stable environment of the 1990s.
1990s: Stability, Innovation, and Rising Homeownership
The 1990s were a comparatively calm and prosperous decade for the mortgage and housing market. After the turbulence of prior decades, this era enjoyed economic growth, falling interest rates, and a nationwide increase in homeownership. It also saw the seeds of new lending innovations – some prudent, some risky – that would fully bloom by the 2000s.
Major economic events: The decade began with a mild recession in 1990–91, but the downturn was short-lived. Inflation remained under control throughout the ’90s (generally 2–3%), and the Federal Reserve was able to gradually lower interest rates. Combined with fiscal stability and technological productivity gains, the U.S. experienced one of its longest economic expansions (1991–2001). By the late 1990s, unemployment fell to 4% and incomes were rising, creating strong housing demand. Importantly, the absence of major economic crises in this decade meant mortgage rates followed a gentle downward trend. Average 30-year mortgage rates fell from about 10% in 1990 to around 7% by 1998 (Historical 30-Year Fixed-Rate Mortgage Trends With Charts) (Mortgage Rate History: A Look at Trends from the 1970s to 2024). This drop in rates significantly improved affordability and stimulated homebuying. The government also encouraged homeownership: for example, President Clinton’s National Homeownership Strategy (1995) aimed to broaden mortgage access.
Shifts in lending practices: With relatively low default rates and a healthy economy, lenders became more comfortable expanding their credit box in the ’90s. Adjustable-rate mortgages (ARMs) gained popularity in the mid-1990s (Mortgage Rate History: A Look at Trends from the 1970s to 2024), often with lower introductory rates that appealed to younger buyers. Mortgage underwriting also evolved – FICO credit scores and automated underwriting systems were adopted by Fannie Mae and Freddie Mac, making loan approvals faster and more standardized. The secondary market for mortgages grew robustly: Wall Street firms began creating more private-label mortgage securities (including bundles of “subprime” loans by the late 1990s). Still, compared to the 2000s, subprime lending was niche in the ’90s – most mortgages were conforming loans or government-backed (FHA/VA). Down payment requirements started to ease a bit (with more 5–10% down loans), and new products like home equity lines of credit (HELOCs) became common as homeowners tapped the equity from rising home values. By 1999, the Glass-Steagall Act had been repealed, allowing commercial banks to further engage in mortgage securities and investment banking activities – a deregulatory step with long-term implications.
One noteworthy trend was the increase in homeownership rate. It rose from about 64% in the mid-1990s to 67% by 2000, reflecting the combined effect of lower rates, a strong economy, and wider credit availability (Historical 30-Year Fixed-Rate Mortgage Trends With Charts) (The Great Recession and Its Aftermath | Federal Reserve History). Mortgage debt grew accordingly: total home mortgage debt outstanding at the end of 1990 was around $3.8 trillion, and by the end of the decade it roughly doubled (surpassing $6 trillion by 2000) (Evolution of the U.S. Housing Finance System). This was a substantial jump, though it occurred in step with income and population growth, keeping delinquency rates low.
Impact on home affordability: The 1990s are often remembered as a good time to be a homebuyer. Housing prices increased at a moderate pace in most regions, but mortgage rates over time were trending down, meaning buyers in the late ’90s could lock in loans at the lowest rates seen in decades up to that point (Mortgage Rate History: A Look at Trends from the 1970s to 2024). For example, by 1998 a 30-year fixed loan could be had at ~7%, versus 10%+ eight years earlier – that difference made monthly payments ~25% cheaper for the same loan principal. Combined with rising incomes, this improved home affordability considerably. As a result, more families were able to purchase their first homes. Toward the end of the decade, some local markets did see home prices accelerate (tech-driven markets like California’s Silicon Valley experienced a late-’90s surge), but nationally there was no housing “bubble” – yet. That would come soon, as the favorable conditions of the 1990s set the stage for the dramatic housing boom of the 2000s.
2000s: Housing Boom and Bust – Low Rates, Easy Credit, and Crisis
The 2000s were a rollercoaster for mortgages: a housing boom in the early- to mid-2000s fueled by low interest rates and loose lending, followed by a catastrophic bust in 2007–2008 that sparked the Great Recession. This decade fundamentally changed mortgage lending practices and had a lasting impact on homebuyers and the economy.
Major economic events: After the 2001 dot-com recession, the Federal Reserve slashed rates to revive growth – the federal funds rate fell to just 1% by 2003. This flowed through to mortgages: 30-year mortgage rates dropped to the 5–6% range in the early 2000s, their lowest in decades (Mortgage Rate History: A Look at Trends from the 1970s to 2024). The cheap money, combined with regulatory policies encouraging homeownership, ignited a housing market boom. Home prices started rising rapidly around 2002 and more than doubled nationally between 1998 and 2006, the sharpest increase on record (The Great Recession and Its Aftermath | Federal Reserve History). By 2005, homeownership hit an all-time high of 69% (The Great Recession and Its Aftermath | Federal Reserve History). However, this expansion was accompanied by ever-riskier lending. Banks and mortgage companies lowered standards – offering loans with little or no down payment, no income verification, and initially low “teaser” rates. The mid-2000s saw an explosion in subprime mortgages (loans to borrowers with poor credit) and exotic loan types (option ARMs, interest-only loans, etc.). These were often bundled into complex financial products (MBS and CDOs) and sold globally, spreading and magnifying risk.
By 2007, cracks in this edifice began to show. Home prices had grown unsustainably high relative to incomes, and interest rates ticked up off their lows, cooling demand. Many subprime borrowers who had taken adjustable or balloon-payment loans could no longer afford their payments. Mortgage delinquencies surged, especially in formerly hot markets. The bubble burst: housing prices began falling in 2006–2007, leading to a spiral of defaults and foreclosures. Major financial institutions holding mortgage-backed securities suffered huge losses, triggering a wider financial crisis in 2008. The economy entered the Great Recession (2007–2009), the worst downturn since the 1930s. In response, the Fed aggressively cut rates again and launched emergency programs to stabilize credit. By 2009, mortgage rates had plunged below 5% as the Fed pushed them down to stimulate a recovery (Historical 30-Year Fixed-Rate Mortgage Trends With Charts) (Mortgage Rate History: A Look at Trends from the 1970s to 2024).
Shifts in lending practices: The early 2000s were marked by exceptionally lax lending standards – a stark departure from the cautious approach of prior decades. Banks introduced “NINJA” loans (no income, no job, no assets verification), 100% financing, and subprime loans with high interest rates to millions of new borrowers. Mortgage brokers proliferated, often earning commissions for putting people into higher-risk loans. The assumption was that ever-rising home values would bail everyone out (borrowers could always refinance or sell at a profit). This assumption proved false. After 2008, mortgage lending swung to the opposite extreme. The crisis forced the closure of numerous subprime lenders and drove Fannie Mae and Freddie Mac into government conservatorship in 2008. In the aftermath, lawmakers passed the Dodd-Frank Act (2010), which imposed strict regulations on mortgage lending – including the Ability-to-Repay rule and creation of Qualified Mortgages (QM) that ban features like interest-only periods or negative amortization for most loans. Essentially, by the late 2000s, the era of “easy credit” was over. Banks tightened credit score requirements, demanded documentation for income and assets, and largely required down payments again (except on FHA loans). The government and Federal Reserve also became much more involved in supporting the mortgage market post-crisis, buying agency MBS in large quantities to keep rates low.
Impact on home affordability: This decade saw extremes. In the early- to mid-2000s, homebuying trends were frenetic – low rates made monthly payments initially affordable, and creative financing put homeownership within reach for many who couldn’t have qualified before. However, as prices skyrocketed, even those low rates couldn’t offset the cost: by 2006, homes in many areas were unaffordable by traditional measures (price-to-income ratios hit record highs). For example, U.S. mortgage debt nearly doubled from 2001 to 2007, rising from about $5.3 trillion to over $10 trillion (Subprime mortgage crisis – Wikipedia), indicating buyers were taking on much larger loans (Subprime mortgage crisis – Wikipedia). This debt boom far outpaced income growth and was unsustainable. When the bubble burst, the impact on homeowners was devastating. Home values fell by 20–30% on average (more in the hardest-hit regions), wiping out equity. By 2010, roughly one in every ten mortgage borrowers was in delinquency or foreclosure – the mortgage crisis impact was felt across the nation. Families who bought at the peak often ended up owing more than their home’s value (“underwater” mortgages). On the other hand, for those with stable finances, the post-2008 environment finally brought some relief: if you could qualify for a loan, the sub-5% interest rates from 2009 onward made buying or refinancing very attractive. In sum, the 2000s taught hard lessons about housing bubbles and debt. It ended with much stricter lending and a cautious outlook that carried into the next decade.
(Mortgage debt trends note: U.S. household mortgage debt rose from about 61% of GDP in 1998 to 97% of GDP in 2006, reflecting the massive run-up in borrowing during the boom (The Great Recession and Its Aftermath | Federal Reserve History). After 2008, this debt burden began to ease as households defaulted or paid down loans.)
2010s: Recovery, Reform, and Record-Low Rates
In the 2010s, the U.S. mortgage landscape gradually healed from the Great Recession. This decade saw a return to more sober lending practices, new regulations to protect consumers, and historically low interest rates that spurred a rebound in the housing market. Home prices recovered and eventually surpassed their prior peaks, although the memory of the crisis kept both borrowers and lenders cautious for much of the period.
Major economic events: The early 2010s were dominated by the slow recovery from the financial crisis. High unemployment and tight credit persisted in the first few years, dampening home sales. To support the economy, the Federal Reserve kept short-term interest rates near 0% from late 2008 onward and launched quantitative easing (buying Treasury and mortgage bonds) to push long-term rates down (Historical 30-Year Fixed-Rate Mortgage Trends With Charts) (Historical 30-Year Fixed-Rate Mortgage Trends With Charts). These policies were effective in bringing mortgage rates to record lows. Throughout the 2010s, 30-year fixed mortgage rates mostly stayed between 3% and 5%, dropping as low as ~3.5% in 2012 and again in 2016 (Historical 30-Year Fixed-Rate Mortgage Trends With Charts) (Mortgage Rate History: A Look at Trends from the 1970s to 2024). Such lows were unprecedented – by comparison, the long-term average since 1971 is about 7.7% (Historical 30-Year Fixed-Rate Mortgage Trends With Charts). Low inflation and moderate economic growth allowed rates to remain low without igniting price instability.
The broader economy steadily improved; by mid-decade, housing demand picked up steam. Home prices, which hit bottom around 2011–2012, began rising again. By 2016, national prices had regained their 2006 bubble levels, and then they kept climbing (fueled in part by limited housing supply). Unlike the 2000s, this price appreciation was underpinned by solid fundamentals: job growth, low interest costs, and a demographic wave of Millennials reaching homebuying age. There were a few rate hiccups – the Fed started inching rates up in 2015–2018 (causing mortgage rates to briefly rise above 4.5% in 2018) – but when the economy showed signs of slowing in 2019, the Fed eased again, and mortgage rates fell back under 4% (Mortgage Rate History | Chart & Trends Over Time 2025). By the end of the decade, the stage was set for an even more dramatic rate move (though no one anticipated the pandemic that was about to come).
Shifts in lending practices: The 2010s were a period of significant reform in mortgage lending. The Dodd-Frank Act’s rules took effect, and the newly formed Consumer Financial Protection Bureau (CFPB) enforced strict underwriting standards. Most mortgages made were “Qualified Mortgages,” which, for example, prevented loans with excessive debt-to-income ratios or no documentation. Risky products like negative amortization or stated-income loans virtually disappeared from the mainstream market. Lenders focused on borrowers with good credit – indeed, the average credit score for approved loans in the 2010s was much higher than in the 2000s. Government’s role in the mortgage market was huge: with Fannie Mae and Freddie Mac under conservatorship, around 70% of new loans were backed by these agencies or other federal entities (Mortgage Statistics: 2025 | LendingTree) (What is the state of household debt in the US? | USAFacts). This meant the 30-year fixed remained widely available at low rates. Private-label securitization (which had funded many subprime loans) was a shadow of its former self. As a result, mortgage debt growth was modest – many Americans were still deleveraging from the last crisis. In fact, from 2008 through about 2013, the total mortgage debt outstanding in the U.S. actually fell slightly as people paid down or defaulted on loans. It wasn’t until the mid-2010s that aggregate mortgage debt began rising again. By 2019, total home mortgage debt was roughly $9.6 trillion, still below the pre-crisis peak in inflation-adjusted terms (What is the state of household debt in the US? | USAFacts).
Another shift was the rise of financial technology in home lending. Online mortgage platforms and digital application processes became common, making it faster and simpler to get a loan (for qualified borrowers). Non-bank lenders (like Quicken Loans/Rocket Mortgage) grew market share, often specializing in refinancing. Refinancing was indeed a big theme of the 2010s – millions of homeowners took advantage of low rates to refinance into cheaper payments, which freed up income and also improved the average credit quality of outstanding mortgages (since those who qualified to refinance generally had solid finances).
Impact on home affordability: Thanks to record low interest rates, the 2010s were generally a favorable decade for affordability – at least in terms of monthly payments. A buyer in 2015 could get a 30-year loan at ~4% interest; compared to a 7% rate, that difference saved roughly 30% on the monthly payment for the same loan principal. This boosted affordability and allowed home prices to rise without crushing buyers’ budgets. By the latter half of the decade, however, home prices in many cities were climbing faster than incomes, due to limited supply of homes for sale and growing demand. This started to erode some of the affordability advantage of low rates. For example, from 2012 to 2019, U.S. median home prices rose considerably, which, combined with slightly higher rates in 2018–2019, meant first-time buyers had to stretch (often relying on low-down-payment programs). Homeownership, which had fallen to about 63% in 2016, inched back up to 65% by 2020, indicating that more buyers were managing to enter the market as the economy improved. Overall, the 2010s housing market recovery restored equity for homeowners (by 2019, homeowners’ equity in real estate reached a new high) and saw mortgage interest rates over time hit their lowest levels in history (Mortgage Rate History: A Look at Trends from the 1970s to 2024). It was a stable period, ending on a high note – but that would change suddenly with the pandemic upheaval of 2020.
2020s: Pandemic Swing and Return of Rising Rates
The 2020s (so far) have been marked by dramatic swings in the mortgage landscape in just a few short years. The decade began with the COVID-19 pandemic, which brought about both the lowest mortgage rates ever and an unexpected housing boom. More recently, a surge in inflation has led to rapidly rising rates, posing new challenges for homebuyers and the housing market.
Major economic events: In 2020, the pandemic caused a sudden economic shutdown. The Federal Reserve responded by slashing interest rates to near-zero in March 2020 and restarting massive bond-buying, including mortgage-backed securities (Historical 30-Year Fixed-Rate Mortgage Trends With Charts) (Historical 30-Year Fixed-Rate Mortgage Trends With Charts). These emergency actions drove mortgage rates down to unbelievable lows. By late 2020 and into 2021, 30-year mortgage rates fell under 3% – the average 30-year rate hit about 2.77% in August 2021, the lowest on record (Historical 30-Year Fixed-Rate Mortgage Trends With Charts) (Mortgage Rate History: A Look at Trends from the 1970s to 2024). This gave qualified buyers unprecedented buying power. Coupled with pandemic-driven lifestyle shifts (like the rise of remote work) and a limited inventory of homes for sale, the result was a housing market frenzy. Home prices skyrocketed from mid-2020 through 2021 at their fastest pace in decades, as buyers rushed to capitalize on cheap financing. Paradoxically, the pandemic created a housing boom, with home sales and prices reaching new highs.
By 2022, however, the economic environment shifted sharply. Inflation, which had been dormant for years, came roaring back – reaching over 8% in 2022, a level not seen since the early 1980s. The Federal Reserve pivoted to inflation-fighting mode, raising interest rates aggressively from spring 2022 onward (Historical 30-Year Fixed-Rate Mortgage Trends With Charts). Mortgage rates followed suit, more than doubling in a matter of months. From around 3% in early 2022, 30-year rates jumped above 5% by May 2022 (Historical 30-Year Fixed-Rate Mortgage Trends With Charts), and kept climbing to around 7% by late 2023, the highest in about 20 years (Historical 30-Year Fixed-Rate Mortgage Trends With Charts) (Mortgage Rate History: A Look at Trends from the 1970s to 2024). This rapid spike in rates, combined with still-high home prices, has cooled the housing market considerably. Home sales volumes have fallen in 2022–2023, and price growth flattened in many areas (even dipping in some markets) as affordability waned. As of early 2025, mortgage rates are fluctuating in the mid-6% to low-7% range – much higher than a couple of years ago, though still below the extreme peaks of the 1980s (Mortgage Rate History: A Look at Trends from the 1970s to 2024) (Mortgage Rate History: A Look at Trends from the 1970s to 2024). Meanwhile, the broader economy has been resilient, and unemployment remains low, but buyers and sellers alike are adjusting to this new rate regime.
Shifts in lending practices: Despite the tumult, mortgage lending standards in the 2020s have remained relatively strict (a legacy of the post-2008 reforms). There was no return to subprime or no-doc lending during the pandemic boom – in fact, a significant share of 2020–2021 buyers were high-income households, and many existing homeowners simply refinanced to the ultra-low rates. Banks did offer some pandemic forbearance programs to help those temporarily out of work, preventing a wave of defaults. As rates rose in 2022, lending volumes plummeted (especially refinance loans), and lenders refocused on creative solutions for affordability – for instance, an uptick in ARMs (adjustable-rate mortgages) offering slightly lower initial rates, or buydown arrangements where sellers help subsidize a buyer’s rate for the first couple of years. Overall though, credit availability has not loosened much; if anything, lenders became more cautious in a rising-rate environment. One notable development is the dominance of non-bank lenders and big-tech platforms in mortgage origination, which has streamlined the application process for many. Also, with home prices so high, loan amounts increased and jumbo loans (for expensive properties) became more common, often requiring strong borrower qualifications. Another trend: many existing homeowners, having locked in 2–3% rates, are choosing not to sell (because they don’t want to give up their low mortgage), contributing to low inventory in the housing market. This “lock-in effect” is a new factor affecting supply.
Impact on home affordability: The 2020s have been a tale of two extremes for affordability. In 2020–2021, record low interest rates combined with still-reasonable prices made monthly mortgage payments very affordable for those who could buy. Indeed, in 2021 the mortgage payment on a median-priced home (with 20% down at ~3% interest) took up a historically small share of median income for many areas. However, the surge in home prices was a double-edged sword – it raised the down payments and overall loan sizes needed, pricing some first-time buyers out despite low rates. Then came the spike of 2022–2023: rising rates caused monthly payments to jump dramatically. For example, a $300,000 30-year loan that cost about $1,265/month at 3% interest would cost about $1,996/month at 7% – over $700 more per month. This swift increase, paired with home prices that in many places were at record highs, led to one of the worst declines in affordability in decades. By late 2022, analysts noted that the typical mortgage payment as a percentage of income was as high as it had been in 1989 or 2006, if not higher. Buyers have responded by either: purchasing smaller or less expensive homes, making larger down payments, or staying on the sidelines hoping for relief. As a result, the housing market cooled – annual home sales in 2023 dropped to the slowest pace in about a decade. The good news: unlike 2008, we haven’t seen a wave of defaults or a mortgage crisis impact on the financial system. This is largely because lending in recent years has been to relatively qualified borrowers, and a strong job market has helped homeowners continue making payments. Indeed, as of 2024 only 0.7% of mortgage balances were 90+ days delinquent, a very low level historically (Mortgage Statistics: 2025 | LendingTree) (Mortgage Statistics: 2025 | LendingTree). So, while affordability is a challenge, the mortgage market’s foundations are currently sturdy.
(On mortgage debt trends: Americans’ total mortgage debt reached a new high of $12.59 trillion in 2024 (Mortgage Statistics: 2025 | LendingTree), exceeding the 2008 peak in nominal terms, but household incomes and population have grown as well. Mortgage debt remains about 70% of all consumer debt outstanding (Mortgage Statistics: 2025 | LendingTree). After adjusting for inflation, household mortgage balances are still slightly below the 2008 peak (What is the state of household debt in the US? | USAFacts), indicating there hasn’t been an over-leveraging on the scale of the mid-2000s.)
Mortgage Interest Rates Over Time (1970s–2020s)
Understanding how mortgage interest rates over time have fluctuated puts today’s market in context. Mortgage rates are highly sensitive to the broader economy – especially inflation and Federal Reserve policy. They peaked in the early 1980s, declined through the 1990s and 2000s (with some ups and downs), hit all-time lows in the 2010s, and then rose again sharply in the 2020s.
From the graph above, you can see the dramatic spike in rates around 1981 (approaching 18%) and the long downtrend that followed (Historical 30-Year Fixed-Rate Mortgage Trends With Charts) (Mortgage Rate History: A Look at Trends from the 1970s to 2024). In the 1990s, rates hovered in the high single digits, then fell to around 6% by the early 2000s. The housing boom of 2003–2006 occurred with 30-year rates roughly 5–6% (Mortgage Rate History: A Look at Trends from the 1970s to 2024). After the 2008 crash, the Fed’s interventions pushed rates to the 3–4% range for much of the 2010s (Mortgage Rate History: A Look at Trends from the 1970s to 2024). Then, the pandemic brought a further dip to under 3% – an anomaly in historical terms (Mortgage Rate History: A Look at Trends from the 1970s to 2024). As of the mid-2020s, with the Fed tightening again, rates have returned to about 6–7%.
It’s worth noting that even after the recent increases, today’s rates are still moderate compared to the 1970s and 1980s. However, they are high relative to the past 15 years. For homebuyers, this means the environment in 2023–2025 feels like a squeeze, especially coming after a decade of ultra-low rates. Keeping an eye on economic indicators (like inflation reports or Fed announcements) can give clues about where mortgage rates may head next. Many experts expect that once inflation is firmly under control, rates could stabilize or slightly retreat from recent highs – though predicting exact movements is difficult. In any case, historical mortgage rate trends remind us that today’s “normal” of ~6% could change; flexibility and preparedness are key for borrowers.
Mortgage Debt Growth in the U.S. (Trends)
Alongside interest rates, the total mortgage debt in the U.S. has grown enormously from the 1970s to today. Americans have collectively taken on more mortgage debt each decade, reflecting both rising home values and the greater number of households owning homes. In 1970, the total outstanding home mortgage debt was only on the order of hundreds of billions of dollars. Fast forward to recent years, and that figure is in the tens of trillions. For example, the mortgage debt of U.S. households and nonprofit organizations was about $0.05 trillion in 1950, and grew to $11.75 trillion by 2021 (Rapid Debt Elimination – Financial Advisory Services – Financial Freedom Group | Debt Elimination & Retirement Planning in Charlotte). Just from 2001 to 2007 – during the housing bubble – U.S. mortgage debt almost doubled (Subprime mortgage crisis – Wikipedia). This rapid increase can be seen as more people bought homes (often with minimal down payments) and home prices climbed. After the 2008 crash, the total debt leveled off for a time (many households deleveraged through paydowns or foreclosure). But by around 2016, as the housing market recovered, mortgage debt began rising again. In 2023, total mortgage debt stood at roughly $12–13 trillion and continues to grow with new home purchases and price appreciation (Mortgage Statistics: 2025 | LendingTree).
It’s important to view this debt in context. Relative to the size of the economy (GDP) or as a share of overall household debt, mortgage debt had some ups and downs. It peaked around 2006–2009 in relative terms – for instance, in 2006, household mortgage debt equaled nearly 97% of U.S. GDP (The Great Recession and Its Aftermath | Federal Reserve History), and it was about 73% of total household debt (U.S. household debt in four charts | Reuters). After the crisis, as other types of consumer debt (like student and auto loans) grew and incomes increased, that ratio came down. In 2019, mortgages were about 66% of household debt (U.S. household debt in four charts | Reuters), and ~73% of GDP (U.S. household debt in four charts | Reuters). The takeaway is that Americans are more indebted for housing than they used to be decades ago, but low interest rates in the 2010s made that debt fairly manageable in aggregate (household debt service ratios hit very low levels by 2020 (Household debt – Wikipedia)). Now, with higher rates, the burden of existing debt will increase for those who have adjustable loans or need to refinance, but the majority of current mortgage holders have fixed low rates locked in.
For homebuyers, the growth of mortgage debt underscores the importance of borrowing wisely. It can be tempting to take on a very large loan when credit is available, but history shows the risks of overextension if the market or economy turns. Using tools like affordability calculators (see below) to keep debt within reasonable limits is essential. On the positive side, today’s lending standards aim to ensure buyers can truly afford their mortgages (with lenders verifying income and requiring reasonable debt-to-income ratios), which should help prevent a return to the dangerous debt excesses of the mid-2000s.
Interactive Mortgage Calculator (Placeholder)
Want to estimate your own monthly mortgage payment? Use the interactive mortgage calculator below to plug in a home price, down payment, interest rate, and loan term. This can help you understand how different interest rates or down payment amounts impact your monthly principal and interest payment. Adjust the inputs to plan your home purchase budget:
Mortgage Calculator
Monthly Payment
Payment Breakdown
This calculator provides an estimate based on the information you enter. Actual loan terms may vary. Contact a mortgage professional for accurate information.
The journey of U.S. mortgages from the 1970s to today has been shaped by inflation booms and busts, regulatory changes, and innovations in finance. Each decade taught its lessons – from the importance of stable prices (learned in the 1980s) to the value of prudent lending (learned in the 2000s). For today’s homebuyers, knowing this history offers valuable insight. It reminds us that neither high mortgage rates nor low ones last forever, and that housing market trends can and do change course. By studying the past, buyers can make more informed decisions in the present. Whether it’s choosing a fixed or adjustable loan, deciding on the right time to buy, or simply negotiating the price of a home, understanding how mortgages have evolved will help you navigate the path to homeownership in the current era.
Sources:
- Sofi Learn – What to Learn from Historical Mortgage Rate Fluctuations (Historical 30-Year Fixed-Rate Mortgage Trends With Charts) (Historical 30-Year Fixed-Rate Mortgage Trends With Charts)
- Federal Reserve History – The Great Recession and Its Aftermath (The Great Recession and Its Aftermath | Federal Reserve History) (The Great Recession and Its Aftermath | Federal Reserve History)
- LendingTree – Mortgage Statistics 2025 (Mortgage Statistics: 2025 | LendingTree) (Mortgage Statistics: 2025 | LendingTree)
- New York Fed – Household Debt and Credit Report, 2023 (What is the state of household debt in the US? | USAFacts) (What is the state of household debt in the US? | USAFacts)
- Kwik Mortgage – Mortgage Rate History: 1970s to 2024 (Mortgage Rate History: A Look at Trends from the 1970s to 2024) (Mortgage Rate History: A Look at Trends from the 1970s to 2024)
- Federal Reserve Bank of St. Louis (FRED) – Mortgage Debt Outstanding (The Great Recession and Its Aftermath | Federal Reserve History) (Rapid Debt Elimination – Financial Advisory Services – Financial Freedom Group | Debt Elimination & Retirement Planning in Charlotte)


